Filter Resources
Search
Product
Content Type
Resource Type

Cybersecurity Maturity Model Certification Mapping Document
Cybersecurity Maturity Model Certification Mapping Document
Information on the Cybersecurity Maturity Model Certification (CMMC) network security practices that can be audited using Nipper.

Proactive security solutions infographic - top three priorities
Proactive security solutions infographic - top three priorities
An infographic which summarises the key report findings, top 3 priorities and the core challenges organizations need to overcome.
Introduction to Nipper for risk-based vulnerability management
Introduction to Nipper for risk-based vulnerability management
In this webinar, we’ll introduce Nipper and show you how to automate accurate, on-demand security assessments for routers, switches, and firewalls.
NCSC CAF Automation Capability Summary: Resilience risk and exposure visibility automated by Nipper Resilience
NCSC CAF Automation Capability Summary: Resilience risk and exposure visibility automated by Nipper Resilience
Your guide to the Contributing Outcome and Indicator of Good Practice evidence automated by Nipper Resilience for routers, switches and firewalls in your essential functions.
Emerging best practice in the use of proactive security solutions
Emerging best practice in the use of proactive security solutions
Research, carried out by Omdia, reveals more than 70% of organizations have increased spending on Proactive Security solutions to improve the attack surface
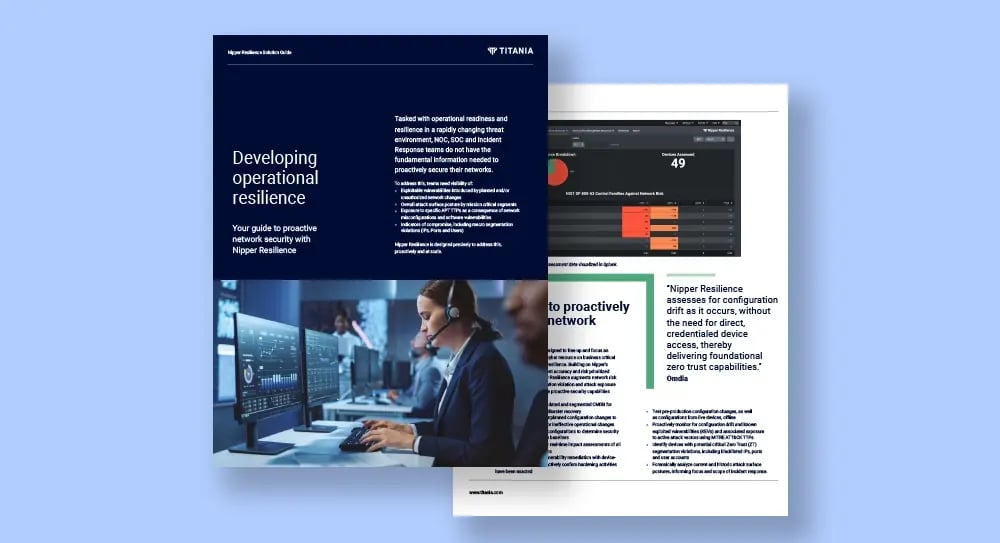
Nipper Resilience solution guide: Proactive Network Security
Nipper Resilience solution guide: Proactive Network Security
Developing operational readiness and resilience in a rapidly changing threat environment - Your guide to proactive network security with Nipper Resilience.
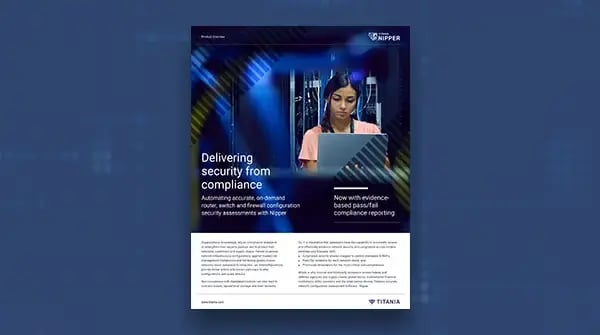
Nipper Product Overview - Risk-based Vulnerability Management
Nipper Product Overview - Risk-based Vulnerability Management
Delivering security from compliance - Automating accurate, on-demand router, switch and firewall configuration security assessments with Nipper.

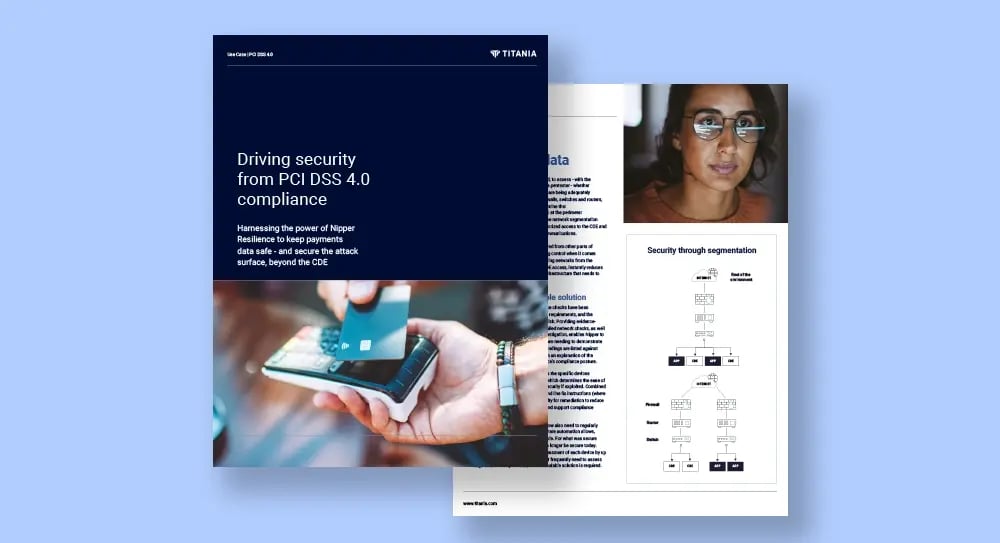
PCI DSS 4.0 Use Case - Driving security from PCI DSS compliance
PCI DSS 4.0 Use Case - Driving security from PCI DSS compliance
Driving security from PCI DSS 4.0 compliance. Harnessing Nipper Resilience to keep payments data safe - and secure the attack surface, beyond the CDE.
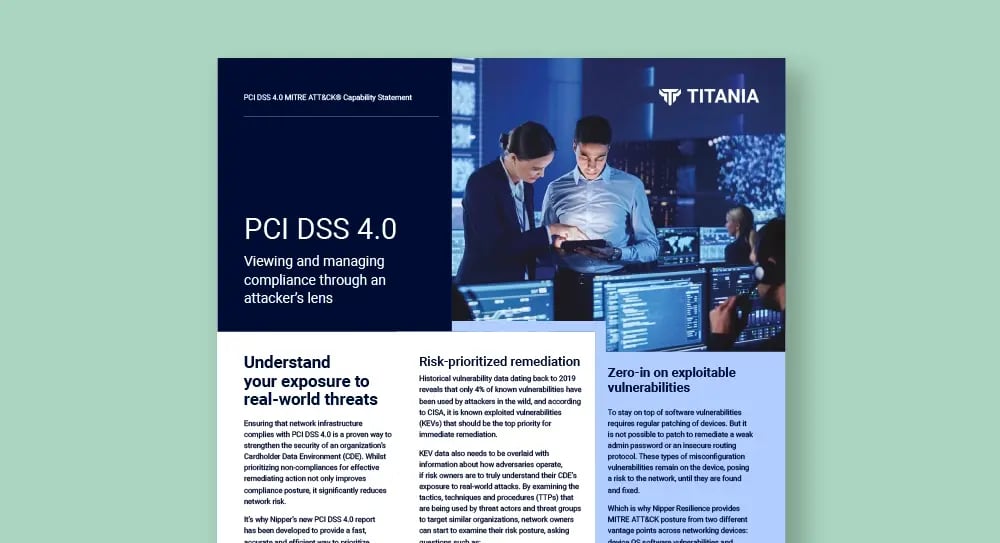
PCI DSS 4.0 MITRE ATT&CK® Capability Statement
PCI DSS 4.0 MITRE ATT&CK® Capability Statement
Viewing and managing your organization's compliance through an attacker's lens to understand your exposure to real-world threats.
On-demand security & compliance assessments by Nipper
On-demand security & compliance assessments by Nipper
Close your most critical security and compliance gaps. Find out how Nipper can help with on-demand, risk-based network device configuration assessments.
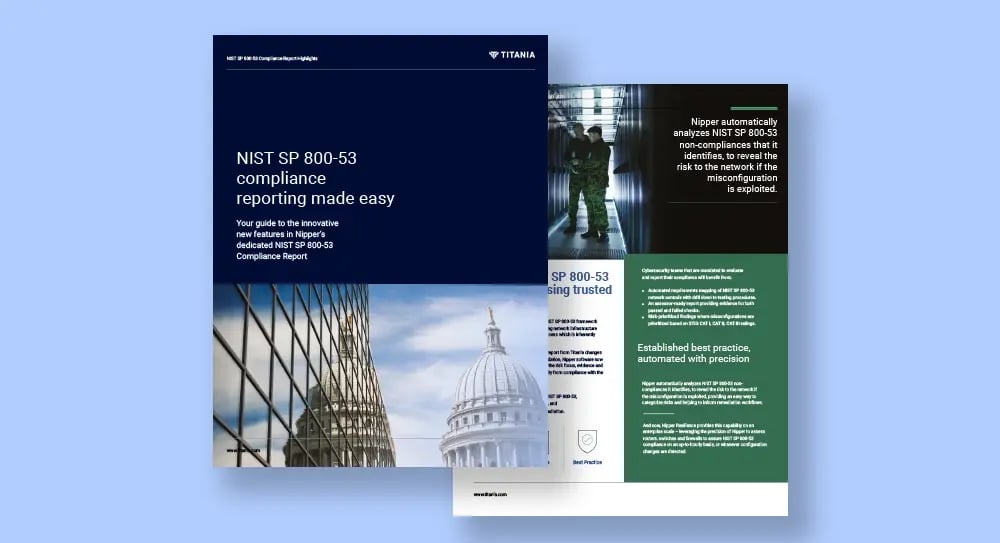
NIST SP 800-53 Compliance Reporting Highlights Guide
NIST SP 800-53 Compliance Reporting Highlights Guide
A guide exploring the innovative new features that are now available in Nipper and Nipper Resilience's dedicated NIST SP 800-53 compliance report.

Cybersecurity glossary - essential terms and concepts
Cybersecurity glossary - essential terms and concepts
This cybersecurity glossary is designed to provide a resource for understanding the essential terms and concepts in the field of cybersecurity.

.jpg?width=5120&height=2880&name=shutterstock_1590824857%20(2).jpg)
Using Nipper Resilience data to report on top exploited vulnerabilities
Using Nipper Resilience data to report on top exploited vulnerabilities
Organizations must be able to identify and report on which CVEs their network is exposed to (currently and historically) to carry out effective mitigation and remediation. Achieving this on an enterprise scale network presents numerous challenges.
On the radar: Config assessments for security and compliance
On the radar: Config assessments for security and compliance
“Nipper Resilience adds a level of proactive security risk assessment and vulnerability management, which complements nicely the kind of server-centric vulnerability assessment enabled by the likes of Qualys and Tenable.”
Validating network configurations - A top consideration for CNIs
Validating network configurations - A top consideration for CNIs
Latest research reveals the key challenges that cybersecurity teams face when managing their organization's PCI DSS compliance
State sponsored attacks exploit publicly known vulnerabilities
State sponsored attacks exploit publicly known vulnerabilities
Use Case: Identifying network compromise and prioritizing remediation. State sponsored attacks exploit publicly known vulnerabilities. Early detection of such attacks is vital.
What is Zero Trust and how can it be achieved?
What is Zero Trust and how can it be achieved?
An introduction to Zero Trust for NOC and SOC teams
The impact of exploitable misconfigurations on network security
The impact of exploitable misconfigurations on network security
New report reveals U.S. Federal Government exposed to significant cybersecurity risks due to exploitable network misconfigurations.
The financial impact of exploitable misconfigurations on network security
The financial impact of exploitable misconfigurations on network security
Find out why there is a disconnect between network security perception and the costly reality, and just how much firewalls are prioritized over switches and routers.
Impact of exploitable misconfigurations on network security
Impact of exploitable misconfigurations on network security
Infographic sharing the key highlights from independent study into the impact of exploitable misconfigurations on network security.


NIST releases guidance on managing supply chain cybersecurity
NIST releases guidance on managing supply chain cybersecurity
Earlier this month, a revised version of NIST SP 800-161 was released. The update provides federal agencies with the latest guidance on identifying, assessing, and responding to risks throughout the supply chain.
.jpg?width=1800&height=1013&name=Department%20of%20Defense%20urges%20use%20of%20continuous%20Authorization%20To%20Operate%20(cATO).jpg)
DoD urges use of continuous Authorization To Operate (cATO)
DoD urges use of continuous Authorization To Operate (cATO)
A memorandum was released for senior pentagon leadership, defense agencies and Department of Defense (DoD) field activity directors urging the use of continuous Authorization To Operate (cATO).

The transition to zero trust: How prepared are federal agencies?
The transition to zero trust: How prepared are federal agencies?
ZTA deadlines are fast approaching: How far have federal agencies got with the implementation of their zero trust strategies?

Network segmentation is key to improving data security
Network segmentation is key to improving data security
When implemented correctly, a network segmentation strategy can effectively isolate attacks within the network to minimize harm.

Ransomware attacks: Kronos in chaos with millions affected
Ransomware attacks: Kronos in chaos with millions affected
There is a misconception that organizations that regularly backup their systems are immune from severe damage in the event of a cyberattack.

An update on the Apache Log4j vulnerability and Nipper
An update on the Apache Log4j vulnerability and Nipper
Titania confirms that neither Nipper nor Nipper Resilience are susceptible to this vulnerability as they do not use the affected Log4j Java library.
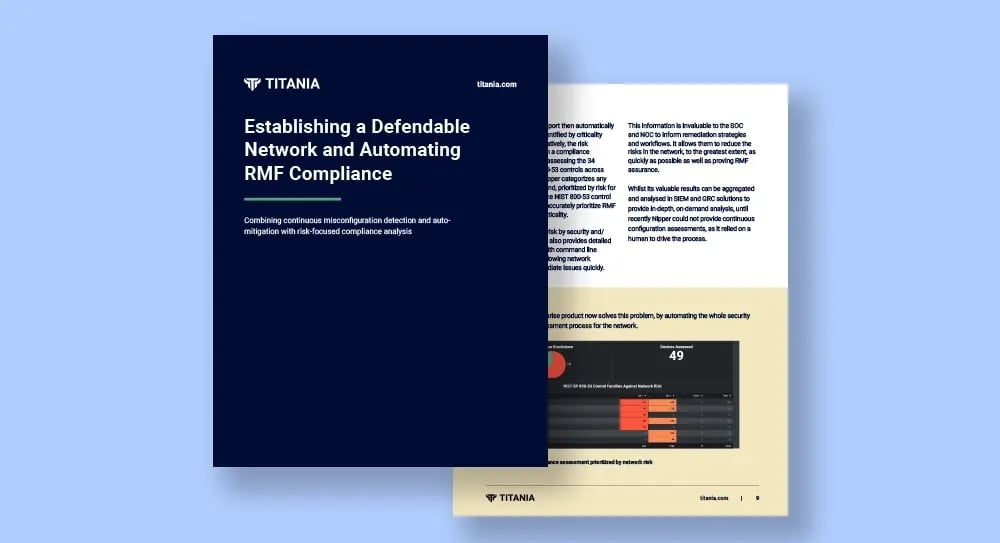
Establish a defendable network & automate RMF compliance
Establish a defendable network & automate RMF compliance
Combining continuous misconfiguration detection and auto-mitigation with risk-focused compliance analysis with Nipper solutions.
Reducing MTTR vulnerabilities with accurate remediation guidance
Reducing MTTR vulnerabilities with accurate remediation guidance
Carrying out a vulnerability assessment on your network devices is one of the first steps in establishing a more secure network.
.png?width=1000&height=500&name=Nipper%E2%80%99s%20risk%20prioritization%20compared%20to%20the%20Common%20Vulnerability%20Scoring%20System%20(CVSS).png)

Vulnerability Audits for Routers, Switches and Firewalls
Vulnerability Audits for Routers, Switches and Firewalls
Configuration audits of routers, switches and firewalls are important to give visibility of the vulnerabilities within the network.


FISMA Compliance Checklist - 7 Steps To Stay Compliant
FISMA Compliance Checklist - 7 Steps To Stay Compliant
Here is a 7-step checklist to stay in compliance with the core requirements of The Federal Information Security Modernization Act (FISMA).

What is NIST SP 800-172? Requirements for protecting CUI
What is NIST SP 800-172? Requirements for protecting CUI
This guide explores the NIST 800-172 special publication, the background to the framework, and its requirements for achieving compliance.

NIST SP 800-53 compliance explained - How to be compliant
NIST SP 800-53 compliance explained - How to be compliant
This guide explores NIST SP 800-53, its controls and requirements, and tips to help organizations achieve and maintain compliance.

Cybersecurity Maturity Model Certification Compliance Checklist
Cybersecurity Maturity Model Certification Compliance Checklist
This checklist helps contractors prepare the network for CMMC compliance and includes a point-by-point rundown of the 17 CMMC domains.

What are DISA STIGs and how can you demonstrate compliance?
What are DISA STIGs and how can you demonstrate compliance?
This guide explores DISA STIGs, what they consist of, and an overview of solutions that can help your organization achieve compliance.


Setting realistic expectations for preventing ransomware attacks
Setting realistic expectations for preventing ransomware attacks
In the aftermath of the recent high-profile ransomware attack on Colonial Pipeline, there are clear and tangible consequences that have been experienced by the general public.

What is FISMA Compliance? | FISMA Compliance Explained
What is FISMA Compliance? | FISMA Compliance Explained
The Federal Information Security Management Act (FISMA) was passed in 2002 and made it a requirement for federal agencies to implement cybersecurity programs to protect systems and information.
Dr R. Ross|Cybersecurity Standards & Supply Chain Risk Management
Dr R. Ross|Cybersecurity Standards & Supply Chain Risk Management
Panel discussion with Dr. Ron Ross, John Weiler from the CMMC Center of Excellence and Titania's Phil Lewis and and Matt Malarkey.

What is CMMC? Cybersecurity Maturity Model Certification
What is CMMC? Cybersecurity Maturity Model Certification
The CMMC is a framework of standards for cybersecurity implementation designed to increase resilience against cyber-attacks throughout the DIB. This guide explores the process for certification.
Titania Nipper, v2.10 extends support up to PAN-OS 9.1
Titania Nipper, v2.10 extends support up to PAN-OS 9.1
The latest release of Nipper extends support up to PAN-OS 9 and 9.1, providing richer reports for users auditing Palo Alto firewalls.

Discover how the transport industry uses Nipper to secure network devices
Discover how the transport industry uses Nipper to secure network devices
Watch our webinar to discover how this International airport used Nipper to bolster it's cybersecurity by auditing routers, switches and firewalls, and identify fixes to ensure security and compliance.

What is NIST SP 800-171 and how can you stay compliant in 2025?
What is NIST SP 800-171 and how can you stay compliant in 2025?
This guide explores NIST SP 800-171, what it consists of, and the steps that organizations need to take to become compliant.

Firewall Management: The Expert Best Practice Guide
Firewall Management: The Expert Best Practice Guide
This guide aims to simplify the topic of firewall management, highlighting best practice processes and procedures for organizations of all sizes.
Latest Nipper release saves time on Cisco ASA device audits
Latest Nipper release saves time on Cisco ASA device audits
Nipper 2.9.1 focuses on enhancements to the Cisco PSIRT plugin and improvements in accuracy, stability and usability across several other report plugins and devices.

NIST 800-171 - What tools can I use to write my Plan of Action?
NIST 800-171 - What tools can I use to write my Plan of Action?
Compliance with NIST SP 800-171 is a contractual obligation for organizations that process Controlled Unclassified Information (CUI) on behalf of the US government.

How can I accurately assess SPRS points for network devices?
How can I accurately assess SPRS points for network devices?
The NIST SP 800-171 Framework: How to quickly and accurately assess SPRS points and achieve compliance for routers, switches and firewalls.

How can I evidence compliance with NIST SP 800-171?
How can I evidence compliance with NIST SP 800-171?
Any organization that processes or stores Controlled Unclassified Information (CUI) for government agencies must be compliant with NIST 800-171.

Software Update: Nipper version 2.9.0 now available
Software Update: Nipper version 2.9.0 now available
The latest release of Nipper (v.2.9.0) offers enhanced reporting for customers securing their routers, switches and firewalls.

DFARS rule change includes more than just a CMMC requirement
DFARS rule change includes more than just a CMMC requirement
The Department of Defense’s (DoD) new cybersecurity standard for contractors – Cybersecurity Maturity Model Certification (CMMC) – cleared two significant steps at the end of September 2020.

Discover how financial institutions use Nipper software
Discover how financial institutions use Nipper software
With financial gain continuing to be the top motive for cyber-attacks it’s no surprise that financial & banking institutions are continually at risk of attack. Join our webinar to learn how to use Nipper to manage your network device risks.


DHS CDM program faces vulnerabilities & insecure configurations
DHS CDM program faces vulnerabilities & insecure configurations
The DHS CDM program leverages automated tools to assess configurations and identify potential vulnerabilities residing on agency networks.


Compliance in a connected world - How hackers exploit the IoT
Compliance in a connected world - How hackers exploit the IoT
As cyber incidents are on the rise, Kirsty Fisher, CFO at Titania explains how hackers are exploiting the so-called ‘Internet of Things’.

‘The Pen Ten’ – 10 tools needed to assess security in 2020
‘The Pen Ten’ – 10 tools needed to assess security in 2020
While many organizations have vulnerability assessment tools in place to identify weaknesses in the network and keep on top of security, penetration testing (or pen testing) provides a nuts and bolts approach to cybersecurity.

Vulnerability scanners vs configuration auditing software
Vulnerability scanners vs configuration auditing software
Both are important when it comes to assessing and maintaining cybersecurity and many of the accepted industry standards mandate both.

Titania and DoD participate in CREST USA Webinar on CMMC
Titania and DoD participate in CREST USA Webinar on CMMC
Titania's Phil Lewis took part in the recent webinar hosted by CREST USA on the US DoD’s new Cybersecurity Maturity Model Certification program.
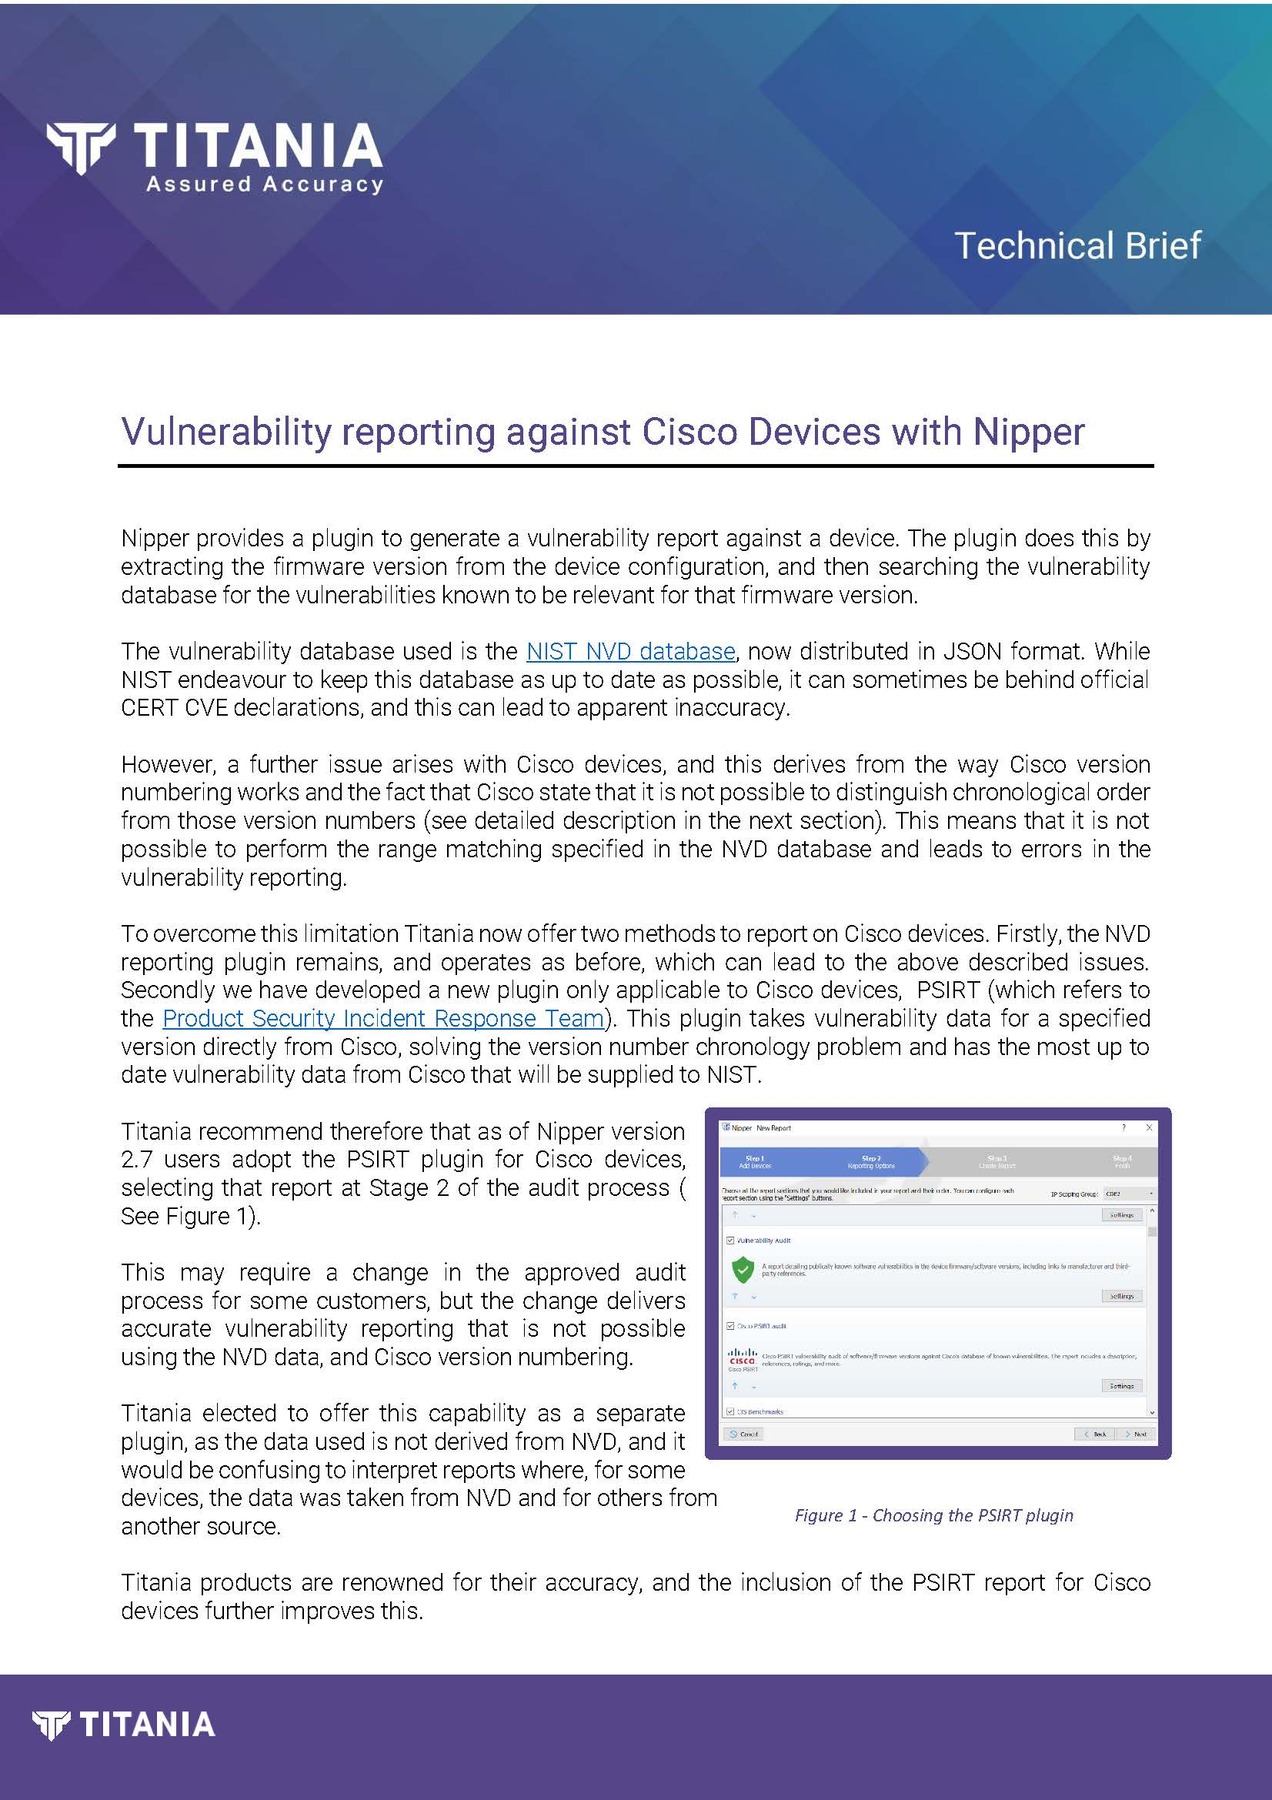
Vulnerability reporting against Cisco Devices with Nipper
Vulnerability reporting against Cisco Devices with Nipper
Nipper provides a plugin to generate a vulnerability report against a device. This extracts the firmware version from the device configuration, and then searches the vulnerability database for relevant vulnerabilities.
Download Nipper, v2.8.0 with Check Point auditing
Download Nipper, v2.8.0 with Check Point auditing
This latest software release, Nipper Version 2.8.0, includes enhanced audit reporting for your organization's Check Point devices.

Crest CMMC webinar: Overview, updates and opportunities
Crest CMMC webinar: Overview, updates and opportunities
Join Titania's Phil Lewis, and other key CMMC stakeholders for an introduction and overview of the US Cybersecurity Maturity Model Certification (CMMC).

Accurately audit compliance with the new CMMC framework
Accurately audit compliance with the new CMMC framework
How Titania Nipper can help your organization to secure your network devices and achieve compliance with the new CMMC framework.


Cyber skills shortage – the true threat to network safeguarding
Cyber skills shortage – the true threat to network safeguarding
What impact is the shortage in cybersecurity professionals having on cybersecurity as a whole, and how can this challenge be tackled?

What types of cyber attacks are on the rise and how can they be avoided?
What types of cyber attacks are on the rise and how can they be avoided?
Titania's Keith Driver discusses the increase in cyberattacks and what organizations can do to strengthen their network defenses.

RMF for DoD contractors | 7 steps for RMF compliance
RMF for DoD contractors | 7 steps for RMF compliance
The Risk Management Framework (RMF) provides guidelines for taking a risk-based approach to information system security and privacy for federal agencies, related contractors and subcontractors.

Nipper Solutions: NIST SP 800-53 Mapping Document
Nipper Solutions: NIST SP 800-53 Mapping Document
Accurately automate the assessment of NIST 800-53 network controls with Nipper solutions to achieve NIST SP 800-53 compliance.

Is your organization achieving compliance with PCI DSS?
Is your organization achieving compliance with PCI DSS?
Find out why your organization needs to be PCI DSS Compliant and how you can achieve this in our PCI DSS infographic download.

Why Vulnerability Assessments are more important than ever...
Why Vulnerability Assessments are more important than ever...
The current environment creates the perfect storm for cyber breaches. The need for organizations to assess the vulnerability of their networks and devices to protect valuable business data has never been greater.

Maintaining PCI DSS compliance with remote working
Maintaining PCI DSS compliance with remote working
With the number of businesses working remotely during the coronavirus outbreak continuing to rise, it has opened up even more potential challenges for those handling sensitive customer payment card data.
Nipper Command Line Interface (CLI) Guide
Nipper Command Line Interface (CLI) Guide
This Nipper guide provides users with assistance when using Command Prompt (Windows) or Terminal (Linux).
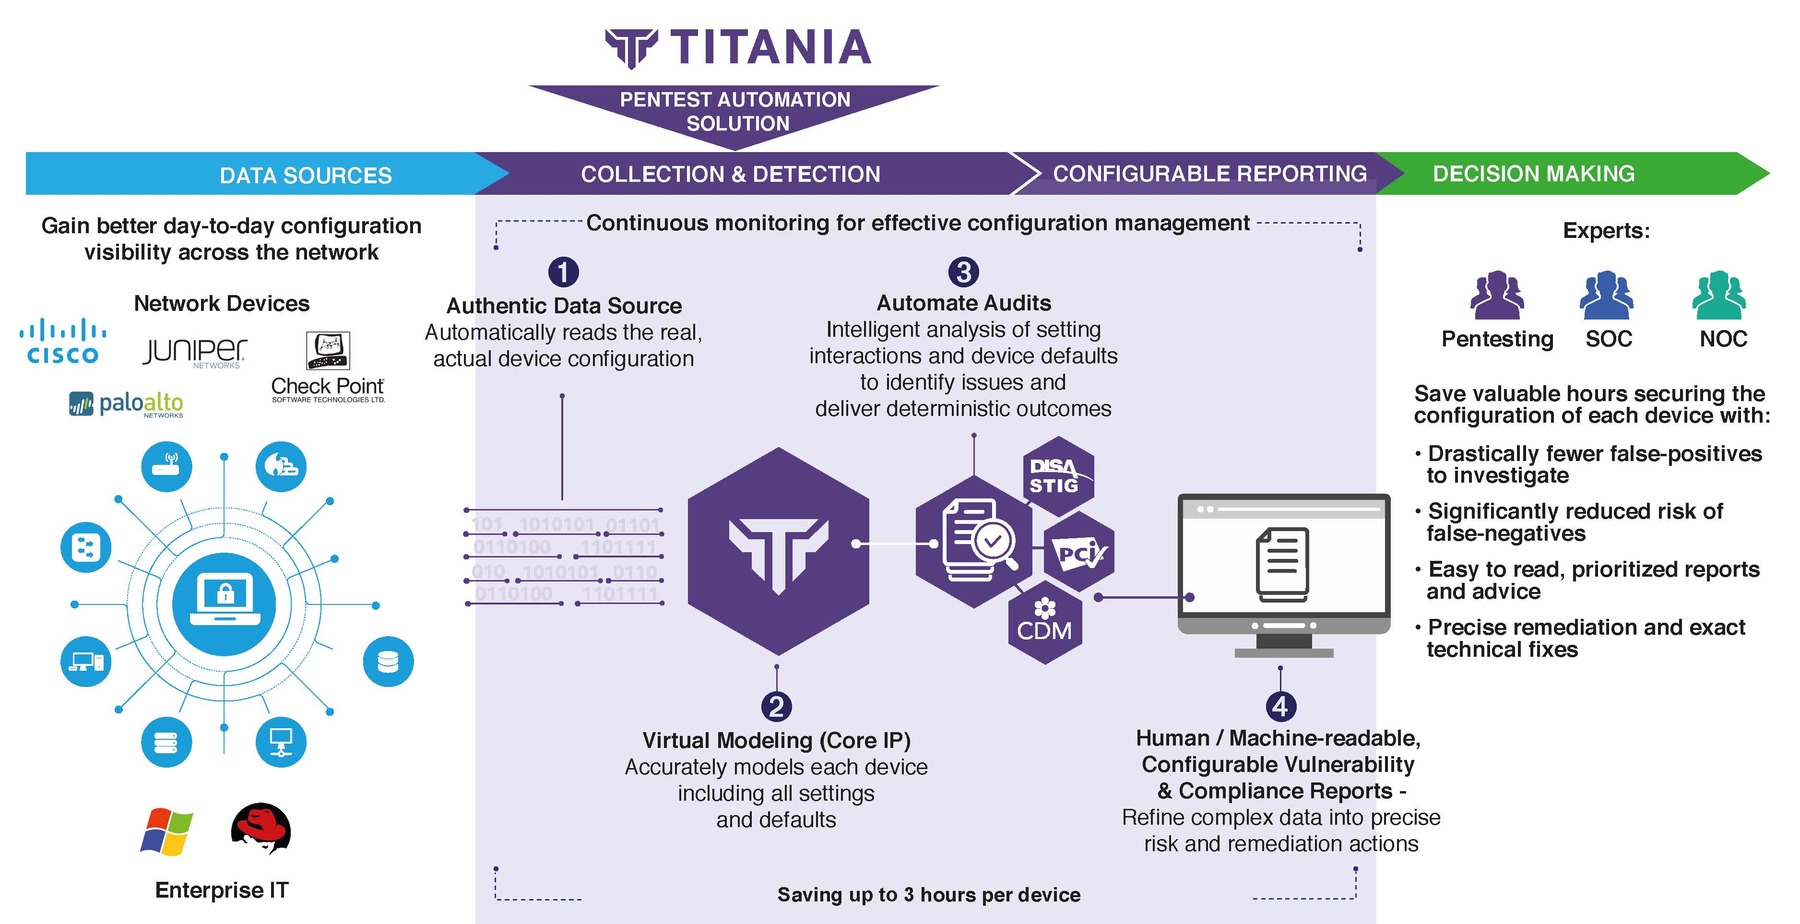
Pentest Automation Solution Infographic - Nipper Solutions
Pentest Automation Solution Infographic - Nipper Solutions
An infographic explaining the technology behind Nipper, our solution for accurate, automated configuration assessments and remediation recommendations.

Staying PCI DSS compliant during the COVID-19 pandemic
Staying PCI DSS compliant during the COVID-19 pandemic
Remote working, consumer spending and vulnerable networks: staying PCI DSS compliant during the global COVID-19 pandemic.


Stay compliant with these 12 high level PCI requirements
Stay compliant with these 12 high level PCI requirements
Over the last twenty years the number of data breaches reported in the United States alone has risen steadily, from 614 data breaches reported in 2013 to 1,579 reported in 2017.